What Is a Double Number Line? A Complete Guide to Ratios, Rates & Percentages
See how this simple diagram makes ratios, rates, unit prices, and percentages easy to solve — with intuitive visual models and step-by-step examples.
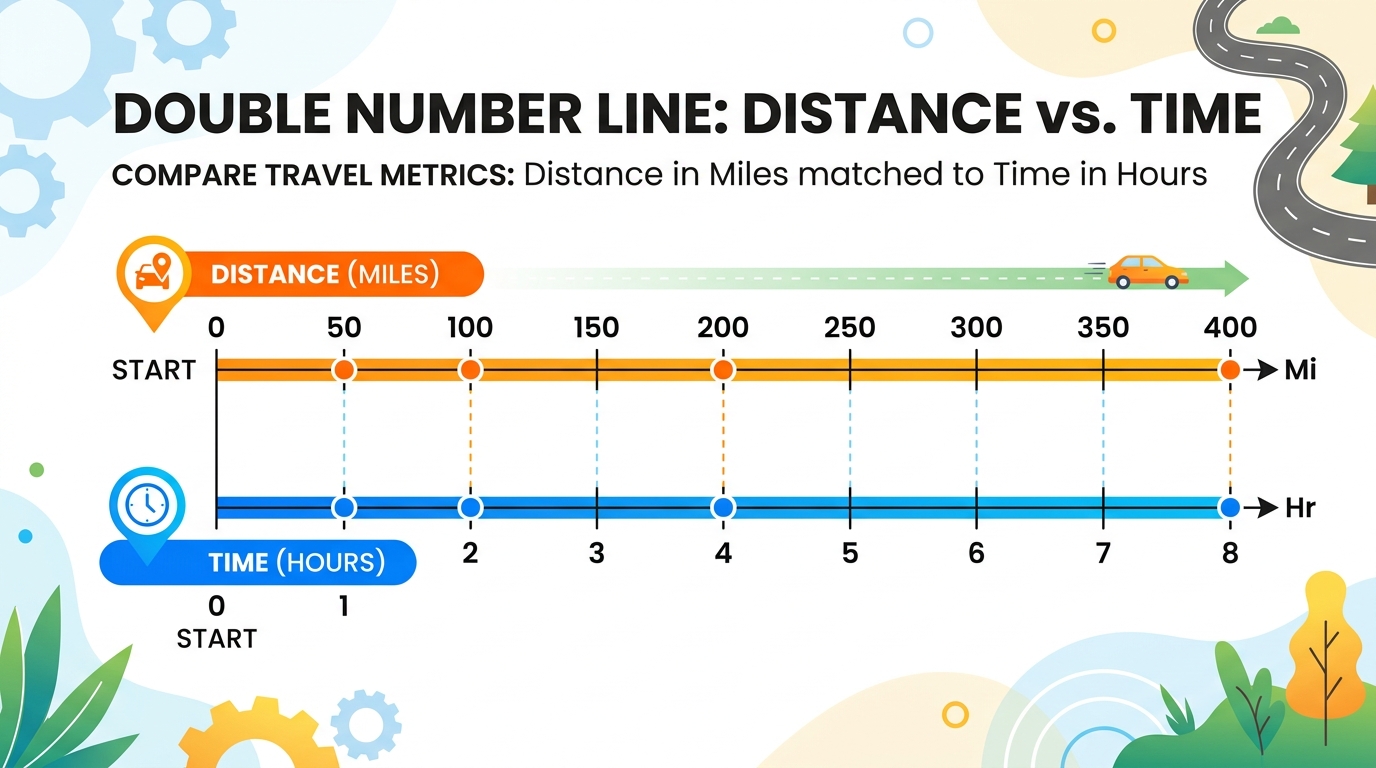
What Is a Double Number Line?
A double number line is a diagram made of two parallel number lines, stacked one above the other, that share a single starting point at zero. Each line tracks a different unit — for example, miles on the top line and hours on the bottom line — and the tick marks are lined up so that any two values sitting directly above and below one another represent an equivalent ratio.
It's one of the most widely used visual models in 6th, 7th, and 8th grade math because it turns an abstract idea — "these two quantities always grow at the same rate" — into something a student can actually see and measure.
How a Double Number Line Diagram Works
Every double number line diagram has the same basic structure:
Top Axis (Quantity A)
Tracks the first unit in the ratio — total distance in miles, cost in dollars, or a percentage from 0% to 100%.
Bottom Axis (Quantity B)
Tracks the matching unit in the ratio — total time in hours, quantity of items purchased, or a dollar amount.
Aligned Zero Point
Both lines start at 0, and every tick mark going right represents one equal "step" in the ratio for both quantities at once.
Because the two lines are aligned, a student can read straight up or down between them to find any missing value — without needing to set up an equation first. That's what makes the double number line diagram so useful before students are formally taught to solve proportions algebraically.
Double Number Lines for Ratios
A ratio compares two quantities, and a double number line diagram makes that comparison visual and repeatable.
Trail Mix Ratio (2:3)
A recipe calls for 2 cups of nuts for every 3 cups of dried fruit (a ratio of 2:3).
Reading the diagram, a student can immediately see that 6 cups of nuts pairs with 9 cups of dried fruit, and 8 cups of nuts pairs with 12 cups of dried fruit — all without multiplying fractions or cross-multiplying anything. This is the core reason a double number line ratio model works so well as a bridge between concrete counting and formal proportional reasoning.
Double Number Lines for Rates and Unit Prices
A rate is a ratio between two different units — like miles per hour or dollars per pound — and the double number line handles it the same way.
Constant Speed (Miles per Hour)
A car travels 50 miles every hour.
Grocery Unit Pricing
Apples cost $3.50 for 2 pounds.
Once the 1-pound tick mark is filled in ($1.75), students can scale that unit rate up or down to answer almost any related question — how much for 5 pounds, how many pounds for $10, and so on.
Double Number Lines with Percentages
Percent problems are one of the places a double number line diagram is most useful, because it lets students see a percentage and its dollar (or quantity) equivalent lined up side by side — which is exactly why "double number line with percentages" is such a common classroom topic in 6th and 7th grade.
Finding a Discount
A jacket normally costs $80, and it's on sale for 25% off. What is the sale price?
Set up the top line as percentage (0% to 100%) and the bottom line as dollar value, with $80 aligned to 100%:
Finding What Percent One Number Is of Another
A student scored 18 out of 24 on a quiz. What percent did they get?
The same structure works for tax, tips, interest, and any "what percent" or "percent of" word problem — the percentage line and the real-world quantity line always move together.
How to Draw a Double Number Line Diagram: Step by Step
Need an interactive visualization?
Try building one interactively with our Skip Counting & Ratios tool or check your work with the Number Line Calculator.
Common Mistakes to Avoid
Uneven Spacing
Tick marks must be evenly spaced on each line — students often bunch numbers together instead of keeping equal intervals, which breaks the visual ratio.
Misaligned Zero Points
If the two zeros don't start at the same spot, every reading afterward will be off.
Skipping the Unit Rate
Finding the "1 unit" value first (like $1.75 per pound) makes every other value on the line much easier to fill in.
Mixing Up Which Quantity Goes on Top
It doesn't mathematically matter, but staying consistent within a single diagram avoids confusion.
Double Number Line vs. Single Number Line
A single number line tracks one quantity and is typically used for counting, addition, and subtraction. A double number line tracks two related quantities at once and is built specifically for ratios, rates, and percentages — it's the natural next step once students are comfortable with a standard number line.
Single Number Line
- • Tracks one variable (e.g. integer counting, distance, time)
- • Best for counting, addition, subtraction, and graphing inequalities
- • Foundation for elementary math (K–5)
Double Number Line
- • Tracks two related quantities simultaneously
- • Best for equivalent ratios, unit rates, scale factors, and percentages
- • Essential bridge for middle school proportional reasoning (Grades 6–8)
Frequently Asked Questions
What is a double number line used for?
A double number line is used to model and solve problems involving ratios, rates, unit prices, and percentages by showing two related quantities on aligned, evenly spaced lines.
What grade level uses double number lines?
Double number lines are most commonly taught in 6th grade math, and continue to be used in 7th and 8th grade for more advanced ratio, rate, and percent problems.
How is a double number line different from a ratio table?
They represent the same relationships, but a double number line shows the values visually along a line with equal spacing, while a ratio table lists the same pairs in rows or columns. Many teachers use both together.
Can a double number line be used for percentages?
Yes — a double number line with percentages typically places the percent scale (0–100%) on one line and the matching real-world quantity (like a dollar amount) on the other, making it easy to find discounts, tips, tax, and "what percent" problems.
Try It Yourself
The best way to understand a double number line diagram is to build one. Start with a simple 1:2 or 1:3 ratio, fill in a few tick marks, and extend the pattern — then move on to a real-world rate or percentage problem.